Friday, December 23, 2016

refrigerator 4

INDEX to the series

I have been keeping a spreadsheet on my old refrigerator, charting the percent of time it operates against the temperature of the air in the kitchen.

I am glad now that I got this data during the summer since the furnace now obscures the signature of the refrigerator and freezer. I wrote about the fridge here, here and then here.

The slope of the line shows that as the temperature around the fridge rises, more electricity is used to keep the inside of the fridge at the set point. I have not varied the settings of the fridge since the second article where I noted that I had switched on the door strip heater by mistake.

For every data point I made a measurement over several hours using my smart meter data. Usually the measurements were in the early morning after the appliance had been undisturbed for at least eight hours. This is the measurement for the Oct 11 data. A screen capture of the Blueline Energy Cloud software in my browser taken into a drawing program (CorelDraw) to add the measurements.

And finally a bit of calculation to turn the centimeter distances into time and to calculate the average time of a number of cycles and the percentage of total time the fridge is running at that temperature.

Since the fridge always uses the same amount of power when it runs, 150 watts, I decided to track the Duty Cycle, or the % of the time the fridge operates. That way I can predict, at a given temperature, how much the fridge will use as a minimum. It may use more than this if I open the door often or fill it with warm food.

I have been turning the fridge off during my peak period and coasting through as much as six hours with no bad effects (spoiled food). I did add a bit more insulation to the outside of the freezer compartment but otherwise the fridge is an old 1994 model.

Thanks for your interest,

George Plhak
Lion's Head, Ontario, Canada

INDEX to the series

Sunday, December 18, 2016

heat 2

INDEX to the series

Last August, I was thinking about how my winter heating needs related to my electrical energy use. Whatever the source, requiring less heating requires less electricity in most cases (unless your primary heat comes from a wood stove perhaps?).

To require less heat, I blocked off the sun porch with a heavy curtain and closed the heating vents to isolate the that room from the rest of the house. Why heat a leaky room? The house has started forming icicles. I have some of the finest icicles in Lion's Head. But the icicles are not forming on the sun porch eaves! As you can see in this pic from a couple years ago, they hadn't formed by mid Jan 2015 either so we will have to see if I have reduced my heating requirement.

My faithful old (made in 1994) Brock furnace has been checked out thoroughly by two service techs, last year and this year. Oil furnaces must have a cleaning each season. Each tech showed me interesting things about the old monster and we've got it tuned up quite nicely and running well. I get about 85% efficiency out the flue but I remind myself that the chimney stack runs through wonderful heat storage (the old chimney masonry) so the flue gas warms up the house a bit more as it exits. I should measure the temperature of the flue gas at the chimney cap about 20 feet up from the furnace. I'll bet that most of the heat stays in the house. I'll call that the "free" exhaust heat ex-changer.

As I will show below, the oil furnace burns heating oil but it uses a fair bit of electricity, about 620 watts while it is running. About half of that electricity is doing useful work contributing to combustion, about 1/2 of the electricity is turned into heat through inefficiency and is "wasted". I remind myself that this waste heat helps to heat the house, so about 310 watts of the electricity is heat input which I need, the rest runs the two motors and the spark coil in the furnace which is also good.

Neither of the techs found my intermittent fault: the furnace tripping reset in the middle of the night for no apparent reason. I replaced the controller and photocell with new Honeywell parts from Amazon for $100 then followed the tests as described by Honeywell and shown to me by experienced furnace techs twice now. Good training on the web too like Steve Lavimoniere, one of my favorite burner techs on Youtube.

I am not recommending you work on your own furnace, not at all! But the more you know about your machines, the better decisions you'll make.

In my experience, both gentlemen seemed more interested in selling and installing a new high efficiency propane furnace than in solving my problem. I had to do that myself. I also fixed some rather sloppy wiring under the twist connectors at the controller. This is how one tech left the orange wire, the output of the controller to the compressor/fan/spark. The start up surge on this line is probably 8-10 Amps. He worked on the connector for several minutes. How long do you suppose this connection, with only a few strands of the wire, would last? Was he making a "time bomb"? I wonder.

I first looked at my furnace on the smart meter back in November. Now it is coming on regularly, about every 1/2 hour for about 20 minutes when the outside temperature is about -10C. It runs 24/7 at this temperature although the spacing between cycles and the run time will vary with the outside and what I tell it I want for the inside temperature (the setpoint).

This is clean recording of a single furnace cycle without anything else going on in the house.

During this test, the house base load is steady at about 80 watts. The furnace starts at 8:50 which both the burner compressor/fan and ignitor coming on. The house usage jumps to about 375 watts. Subttracting the base load gives a furnace draw of (375-80=) 305 watts. The furnace runs for about two minutes until the main furnace air mover fan comes on and the total load becomes about 700 watts. Again, subtracting the base load gives a peak draw for the furnace of (700-80=) 620 watts. Combustion stops when the thermostat reachs set point and the compressor and the spark stop operating. The total usage falls at about 8:58 to 500 watts or (500-80=) 420 watts. The furnace stops at 9:03.

Fairly clear by itself but when the furnace is seen on the smart meter with all the other things going on in the house, the picture is a little more confusing. This is the last few hours early morning at -9C outside. With the additions I have made to the chart, I can pick out consistent markers on the waveform to assign some measurements for the furnace.

When I view the furnace during one of the peak periods, when the other appliances are inhibited (off with timers), its signature becomes a lot clearer. The timers kick in on this pic at 7:00. I got up this morning at about 6:00. From 6:00 to 7:00, I am doing a load of laundry and doing things around the house and shop. Before 6 is the furnace with the refrigerator and freezer mixed in and a lower overnight set point, so it wasn't working as often. The outside and inside set point temperatures will have to be a part of the furnace data.

I would like to be able to build a chart of furnace cycle time versus temperature as I have done for the other major appliances (fridge, freezer and water heater).

I haven't shown you those yet - coming up.

I also talked about adding internal insulation in the form of a Mooney Wall. The idea is to reduce the thermal bridges in the wood by crossing the strapping at right angles to the rafters and studs. This pic shows my progress.

I was a bit concerned about double vapour barrier effects but I found some interesting reading about that here. I believe that since I am going to cover the wall with air and water vapor permeable tongue and groove wood strips there will be lots of gaps in the covering. If there is any condensation on the inside of the poly, it should be able to escape back into the room? I am doing the smaller of the two rooms upstairs as an experiment.

Thank you for your interest,

George Plhak
Lion's Head, Ontario, Canada

INDEX to the series

Wednesday, December 14, 2016

my typical electrical day winter

INDEX to the series

It is winter here in beautiful Ontario, Canada and I am studying my electrical usage with my utility supplied smart meter. When I called in 2007 asking for one of these, I was quoted about $3K. I didn't buy then, now I have one supplied for me. I am trying to learn from it. I showed my usage this summer. I described the study I am a part of.

It seems to me that there will have to be a bigger incentive for people to pay more attention to their demand for electricity. Our electrical system has huge costs to deal with peak use. There has to be a better incentive for us to pay more attention to this issue. Are we emphasizing the supply side (solar, nuclear, wind, water, storage, etc) of the equation?

Personally I am not unhappy with my own electrical bill. The Ontario government is asking for comments. I read the LTEP (Ontario Long Term Energy Plan) and I think the approach described is sensible under the circumstances we face.

There are huge issues with the system. But good news: we are off coal for electricity in Ontario. Our aggregated demand has been falling for six years which makes renewable easier whatever side of that fence you are on. There are uncertainties that would be helped if we all just paid more attention to our time of use. Little personal changes could make a big difference and many of the issues receiving much attention now would reduce.

I have spent $100 so far and I go off the grid for the peak (of at least I am trying). There are still some problems and not everything works. But this is my path so far. It's pretty painless. I still have rock solid utility grade power when I need it. I am helping out the system. They need me to do this and I am getting ready for the new differential in rates, which will be greater, whatever it is. I think the LTEP is a sensible step forward and gave my comments where I felt I had something to contribute.

I am not being paid or influenced by anyone in the debate. Ontario is off coal. We are actually a beacon. More renewable - of course! Who could not agree.

One other point that we all seem to agree on - using less, especially during the peak yet we don't seem to be focusing on that issue? The demand side - ourselves. I believe TOU will soon become more important us all.

The system is not badly broken. We don't need to be so excited about this issue right now. Let's be a calming voice. My 2cents.

(click any picture to enlarge) Lets look again at the winter picture of my electrical use. I have added some notes to the screen capture. The red arrows show my peak periods, there are two of them now, one in the morning and the other around evening mealtime. I am trying to use less electricity during these periods.

The big spikes W are my old electric water heater. It comes on about three or four times a day at 3KW for about ten minutes. Only the clothes dryer uses more at 6KW. I almost never use it preferring instead an indoor clothesline. When I do use the dryer I reclaim the heated moist exhaust for the house in the winter. In summer, the clothes go on my outdoor line.

At 17:00 the water heater probably hadn't finished heating but it got cut off by the timer. You can see that it comes on immediately at the end of the second peak period, at 19:00.

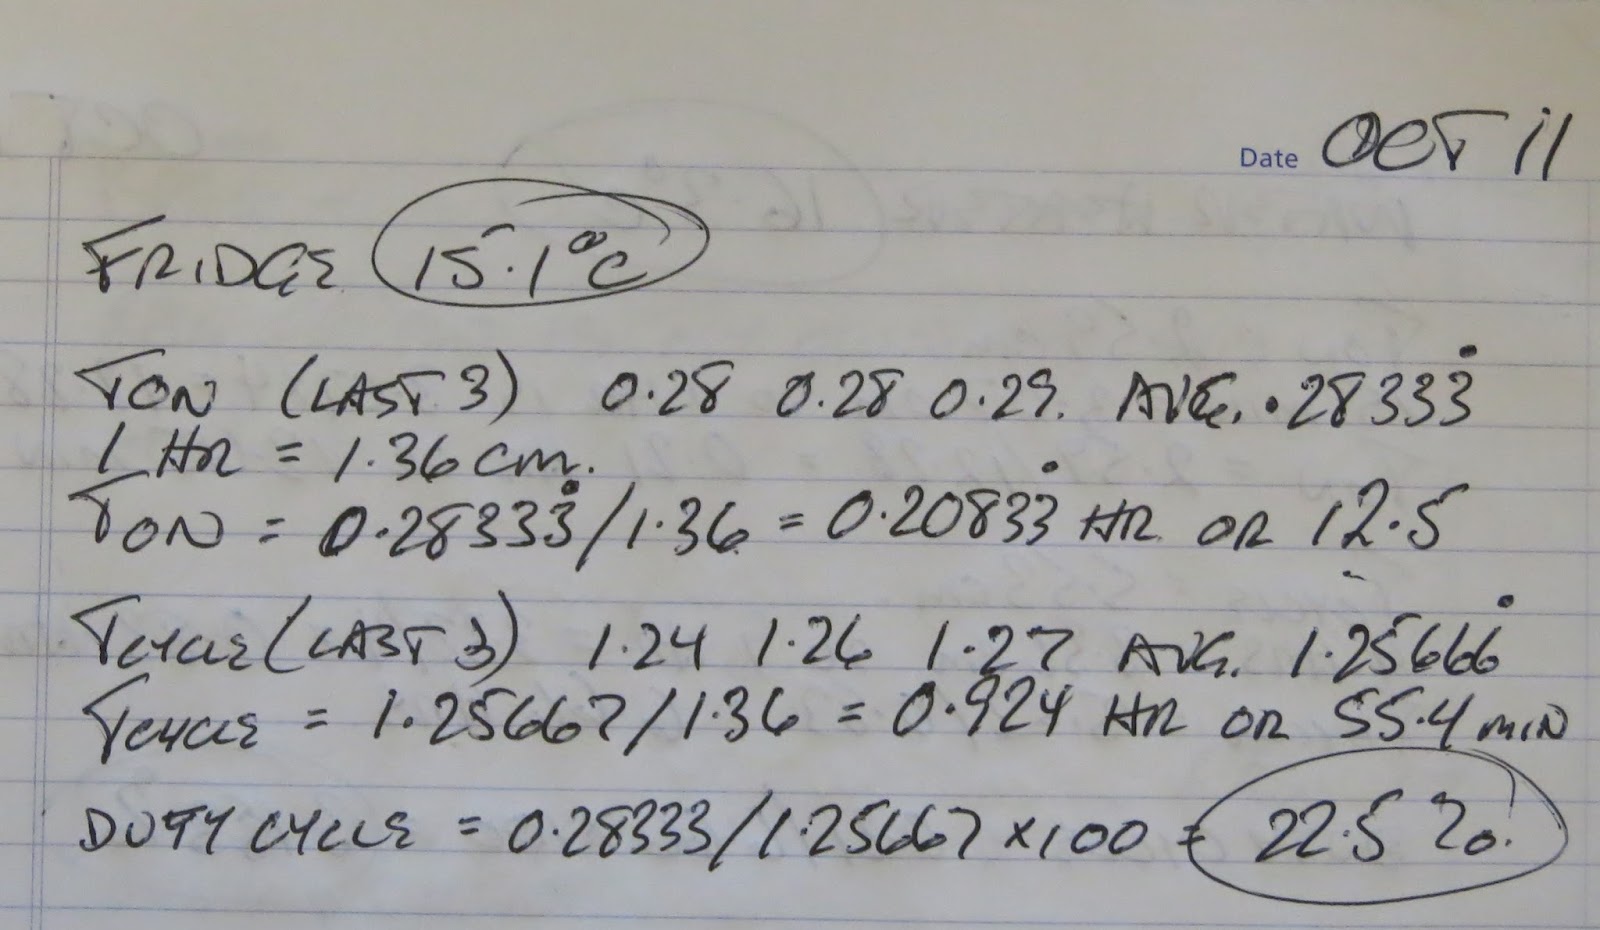
Here is the summer version so I can compare things. There aren't any W spikes in the red during the winter or the summer so I am successfully keeping the water heater from coming on with a timer. My refrigerator and freezer are also on timers so they are not coming on either but the effect is not as noticeable in the winter because of my oil furnace signature. You will see the furnace marching through most of the day. The furnace uses about 700 watts and comes on every half hour to an hour when the temperature outside is sub zero.

On the winter chart in the period A (the peak), you can see the furnace most clearly since the fridge and the freezer aren't running. Notice how the regular steps of the furnace seem to step down just after 9am? That was a mistake actually. I have added a gutter/downspout heater and have left it ON overnight but it was supposed to have been switched off before the morning peak period started. That heater is not yet on a timer. It uses about 300 watts.

The period B on the winter chart is me doing various things around the house against the usual furnace, fridge, freezer and a toaster oven. The air outside the house was warming up a bit by afternoon so the furnace did not come on as often.

Winter period C puzzled me a bit in that it was completely quiet except for that one mini spike. I had expected to see the furnace running since it is not controlled to stay out of the peak period. Then I remembered that I had turned down the heat when I left the house to go out for dinner. The house was cooling down so the furnace did not come on.

My usage during winter C is about 80 watts which is what I am calling my base load (similar to phantom power). The base load is all the low power things that are always on in my house. The small spike I remember is my garage door opener. I came home briefly and opened, then closed the garage door to look for something.

Periods D and E on the winter chart show nighttime electrical use in winter, a noisy mess of the the furnace, the fridge, the freezer, that one big spike from the water heater coming on. Compare to period C on the summer chart which has only the fridge and the freezer. I learned to tell those apart but with the furnace added, it will be more difficult. I should teach a computer how to do this!

I still don't know usage by individual appliance.


Thanks for your interest
George Plhak
Lion's Head, Ontario

INDEX to the series

Saturday, December 10, 2016

conservation

INDEX to the series

Isn't conservation/reduction the real issue?

Would you be willing to share your results with me? Compare yourself to me and the rest of the world with one number. I found it surprising since I have a leaky crappy old house with lots of old appliances and no electric car. It doesn't matter the source (solar/wind/etc) or where you got it, just the usage side, what you used.

It is easy to do. On your bill, you find your total KWh for the month, go back 12 months and add them up. Then divide your result by what you consider to be your household size (that could be interesting for some households).

It is per person. You compare yourself to the rest of the world with ONE NUMBER? It doesn't take a lot of effort.

I need to test this. Comment below with your one number and if it surprises you? A few words if you like but be brief, I am asking for yes/no and the number. I am curious. You know mine.

A link to the ICTSD report. This chart is from Chapter 1, Fig 1.4, page 7. I haven't read the whole thing.

Thanks for your interest.

George Plhak
Lion's Head, ON

INDEX to the series

Sunday, December 04, 2016

home electric progress 2

INDEX to the series

I was actually excited to see my electricity bill this month (haha).

I have been trying to use less peak priced electricity. I went up this month but used less than last year. Lower usage during peak pricing saves on the variable portion of my electricity bill.

Starting in May, I installed timers on the refrigerator, freezer and water heater. That has worked out well and cost less than $100. Throughout a very hot summer I was able to essentially go off the grid for the entire 6 hour peak period each day yet I always had lots of hot water and no food spoiled for me. It was pretty easy.

Now in the heating season, my oil furnace uses electricity, enough to be one of my major electrical appliances (at about 700 watts when running full power). I am controlling the furnace with a programmable thermostat but I haven't tried to align the furnace to not run during the peak periods. The thermostat shifts to lower temperature at night only. I can change it but haven't yet.

I messed up with the change to daylight savings time Nov 6 and the change to the winter price plan Nov 1 however. That didn't get done properly until about two weeks into November, so appliances were not going on and off at the right times and slurping expensive electricity. at almost twice the price. I used twice as much peak as the previous months, 2 KWh average per day as opposed to 1KWh . Sloppy.

I am trying to stay out of the RED triangles. In the winter, there are two red triangles (peak price periods).

The cheap plug in timers I had some problems with. The instructions are a puzzle and difficult to remember. I have to really study each time I want make a change because they make sense but are not intuitive. The two peak periods per day during the winter months makes for an interesting programming challenge. The timers keep pretty good time even through power outages and unpluggings but I did add five minutes to each each setting to ensure I had a error band. The timer display is very hard to see when I am at the appliance so I bought a few spares. I bring them all into a well lit room, figure out how to set one up correctly, program the others the same then plug them back in at their various locations. I then watch their cycles for a few days to make sure I got it right and then forget about them for six months only to have to re-learn them again when the pricing plan changes, or daylight savings.

I would like control and monitoring of each major appliance over my wifi. I can do that for about $75 an appliance. I am experimenting with two types, the Wemo Insight Switch and the TP-Link HS110 Smart Plug with Energy Monitoring. Both have positives and negatives and I am having reliability issues. Both display crankiness if you move them from outlet to outlet but I am moving around more than they normally be. My wired in appliances like the water heater, the furnace and the dryer will need wired in wifi capable versions. Suggestions?

The reports I get from my electricity supplier say that I am doing better than my efficient neigbours. They have improved the customer tools at the Hydro One website. If you haven't looked for a while you might revisit. You have to be registered as a customer to use these. No appliance level data however.

I don't use a lot of electricity but I think I still have room for improvement in reducing and time of use (TOU) shifting. My methods should be usable by someone who uses a lot more than I do and the payback would be better. Common sense required. Your appliances need to be in good condition and properly set for the recommended temperatures before you embark on time shifting them.

I still don't have totals by appliance although I continue to check my usage through my smart meter data. It is heating season now also and the furnace makes the usage graph very much more complicated. More on the furnace coming.

Thanks for your interest.

George Plhak
Lion's Head, Ontario, Canada

INDEX to the series